Key Work Health and Safety Statistics Australia 2024 In Australia, the safety of work has improved significantly over time.
Introduction
Australia’s current work-related injury rate of 3.5% – that is, the proportion of people who experienced a work-related injury or illness in the previous 12 months – is roughly one-third the global rate of 12.1%.1
However, there are still too many injuries and illnesses arising from work.
Over the past 10 years, there have been more than 1,880 traumatic injury fatalities in Australian workplaces, and over 1,165,100 workers have made a serious workers’ compensation claim involving more than one week of working time lost.
All workers have the right to a healthy and safe working environment, yet work‑related injuries and illnesses can occur in any industry or occupation, and the impacts are felt by us all – workers, their families and the community.
Findings from Safe Work Australia’s research, Safer, healthier, wealthier, show that, in the absence of work-related injuries and illnesses, on average each year Australia’s economy would be $28.6 billion larger, 185,500 additional full-time equivalent jobs would be created, and workers across all occupations and skill levels would benefit from an average wage rise of 1.3%.
The benefits of reduced worker injuries, illnesses and fatalities are clear, however the challenges to overcome are significant. According to the latest Key Work Health and Safety Statistics 2024:
- 76% of work-related traumatic injury fatalities and 61% of serious workers’ compensation claims occurred in just 6 industries:
- agriculture, forestry and fishing
- public administration and safety
- transport, postal and warehousing
- manufacturing
- health care and social assistance, and
- construction.
- Vehicle incidents continue to account for the largest proportion of worker fatalities (42%; 84 fatalities). This is followed by Falls from a height (15%; 29 fatalities), which has increased significantly since the previous year (from 17 fatalities; increasing 71%).
- 80% of all serious claims involve Body stressing, Falls, slips and trips, Being hit by moving objects, or Mental stress.
- Claims for Mental health conditions continued to increase in 2022-2023p, and now account for 11% of all serious claims. The median time lost from work in these cases is more than 5 times that recorded across all injuries/diseases.
This report provides a snapshot of the latest WHS data, so we can work together towards safer and healthier work for all.
Download the report: Key Work Health and Safety Statistics Australia 2024
Work-related injury fatalities
Safe Work Australia compiles the Work-related Traumatic Injury Fatalities dataset which provides national statistics on all workers and bystanders fatally injured at work.
This provides statistics about people who die from an injury sustained in the course of a work activity (worker fatalities) in Australian territories or territorial seas.
This dataset draws on a range of information sources, including:
- reporting of fatalities in the media or on relevant authority websites such as police, road authorities and the Australian Transport Safety Bureau
- notifications to Safe Work Australia from jurisdictional authorities, and
- the National Coronial Information System which contains coroners’, police and other investigative reports.
Work-related fatalities resulting from diseases, natural causes and suicides are excluded. Further explanatory notes on the data can be found in the About our datasets page of the interactive data website.
More data is available through our work-related fatalities interactive data dashboard.
In 2023, there were 200 workers who died from traumatic injuries while working.
While the number of fatalities was 5% higher than the 5-year average of 191 workers per year (between 2019 to 2023), the fatality rate was consistent with the 5-year average (1.4 fatalities per 100,000 workers).
Since 2013, the fatality rate has decreased 19% (from 1.7 fatalities per 100,000 workers) however this has remained relatively steady in recent years.
Trends in worker fatalities, 2003 to 2023
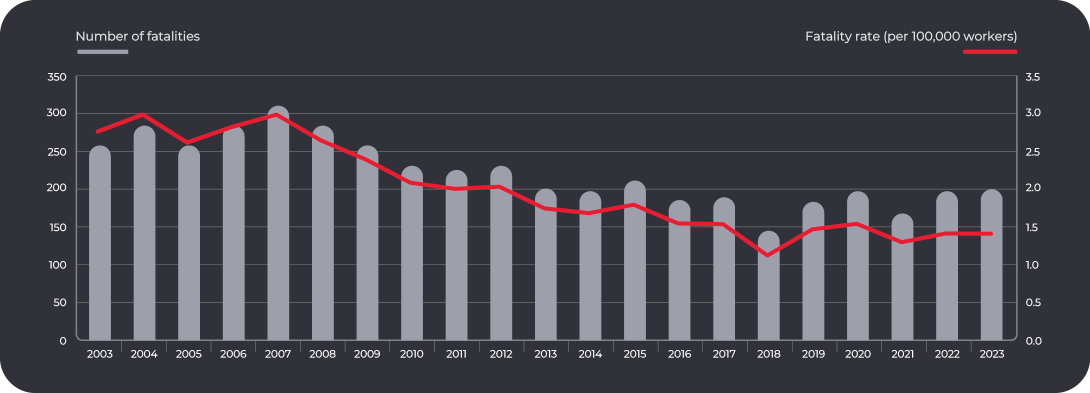
Note: Historical data are updated as additional information from finalised coroners’ reports and workers’ compensation claims becomes available.
i The ‘fatality rate’ is defined as the number of traumatic injury fatalities per 100,000 workers.
Work-related fatalities – Demographics
Worker fatalities by sex, 2023*
|
|
|
|
|---|---|---|
| Worker fatalities (count) |
189 |
10 |
| Worker fatalities (%) |
95% |
5% |
| Fatality rate (per 100,000 workers) |
2.6 |
0.1 |
The vast majority of workers killed from work‑related activities are men (95%; 189 fatalities in 2023).
Men also have a significantly higher fatality rate than women (2.6 fatalities per 100,000 workers).
*data excludes 1 worker fatality where sex was unknown.
Worker fatalities by age group, 2023*
| Age group (years) |
Number of fatalities |
Fatality rate (fatalities per 100,000 workers) |
|---|---|---|
| Under 25 |
27 |
1.2 |
| 25-34 |
29 |
0.9 |
| 35-44 |
35 |
1.1 |
| 45-54 |
38 |
1.4 |
| 55-64 |
40 |
1.9 |
| 65 and over |
27 |
3.9 |
In 2023, workers aged 45 and over accounted for over half (54%) of all worker fatalities recorded.
Workers aged 65 and over had the highest fatality rate at 3.9 fatalities per 100,000 workers (nearly 3 times
the overall worker fatality rate of 1.4 fatalities per 100,000 workers).
Workers aged 25-34 had the lowest fatality rate (0.9 fatalities per 100,000 workers), followed by workers
aged 35-44 (1.1 fatalities per 100,000 workers).
* data excludes 4 worker fatalities where age was unknown.
Worker fatalities by state/territory, 2023*
* fatalities are presented according to the state or territory where the fatality occurred, not the jurisdiction under which the fatality fell.
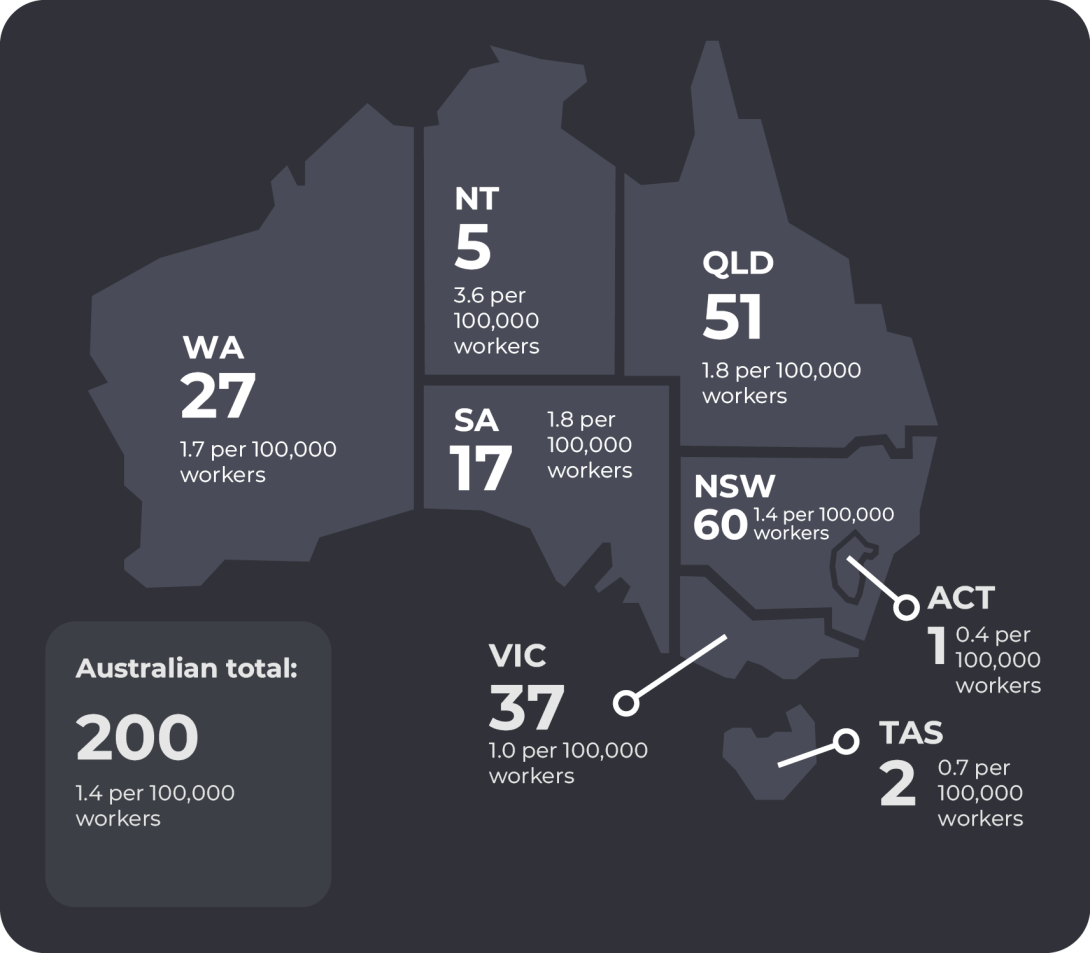
In 2023, New South Wales recorded the highest number of fatalities (60 workers) followed by Queensland (51 workers).
Northern Territory recorded the highest fatality rate (3.6 fatalities per 100,000 workers), followed by Queensland and South Australia (each with 1.8 fatalities per 100,000 workers).
Work-related fatalities – Mechanism
Worker fatalities by most common mechanism of incident, 2023
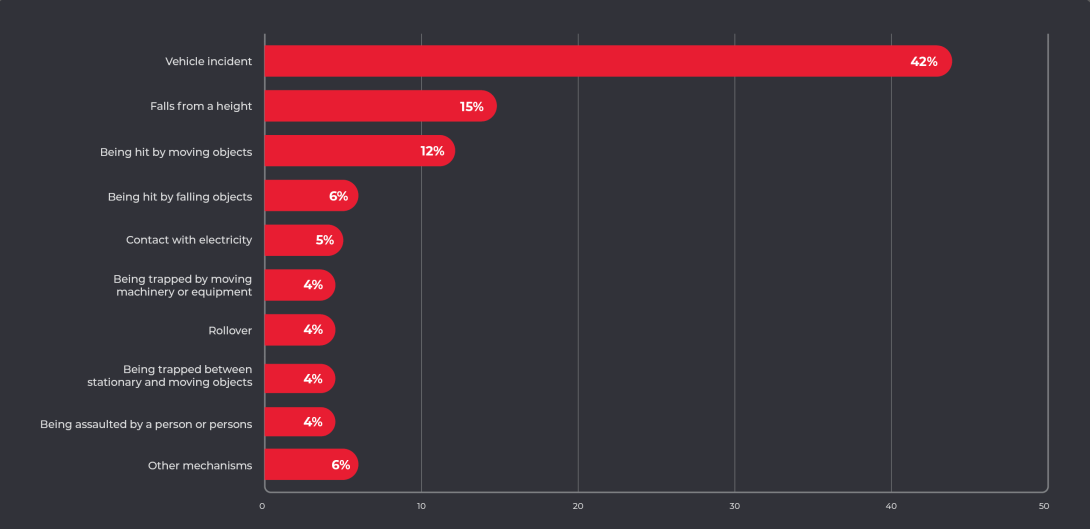
The mechanism of incident refers to the overall action, exposure or event that describes the circumstances that resulted in a worker fatality.
Vehicle incidents (84 workers; 42%) and Being hit by moving objects (24 workers; 12%) accounted for more than half (54%) of all worker fatalities in 2023.
Vehicle incident includes incidents where an occupant of a vehicle is killed following a collision with another vehicle or a stationary object. Vehicles include not only road vehicles such as cars and trucks, but also machines such as aircraft, boats, loaders, tractors and quad bikes.
Being hit by moving objects includes fatalities involving workers on foot being hit by vehicles, as well as being hit by other moving equipment or objects.
Data spotlight: Falls from a height
The number of deaths due to Falls from a height increased in 2023 and was the second highest contributor of worker fatalities overall.
29 worker fatalities (15%) were attributable to the mechanism of incident Falls from a height in 2023.
This is 32% higher than the 5-year average of 22 worker fatalities per year (2019 to 2023).
45% (13) of Falls from a height worker death in 2023 occurred within the Construction industry.
This was followed by worker deaths in the Arts and recreation services, Mining, and Transport, postal and warehousing industries, with 10% (3) worker fatalities occurring in each of those industries in 2023.
Nearly 80% of workers who died due to Falls from a height were Labourers (41%, 12), Technician and trades workers (21%, 6) or Machinery operator and drivers (17%, 5) in 2023.
Worker fatalities – Occupation
Worker fatalities by occupation, 2023
| Occupation |
Fatalities (count) |
Fatalities (rate) |
|---|---|---|
| Machinery operators and drivers |
73 |
8.3 |
| Labourers |
53 |
4.4 |
| Technicians and trades workers |
27 |
1.4 |
| Community and personal service workers |
16 |
1.0 |
| Managers |
15 |
0.8 |
| Professionals |
12 |
0.3 |
| Sales workers |
2 |
0.2 |
| Clerical and administrative workers |
2 |
0.1 |
In 2023, Machinery operators and drivers accounted for the highest proportion of worker fatalities (37%) and also recorded the highest fatality rate at 8.3 fatalities per 100,000 workers, which was almost 6 times the overall fatality rate (1.4 fatalities per 100,000 workers).
Worker fatalities – Industry
Worker fatalities by industry, 2023
| Industry of employer |
Fatalities (count) |
Fatalities (rate) |
|---|---|---|
| Transport, postal and warehousing |
51 |
7.0 |
| Construction |
45 |
3.4 |
| Agriculture, forestry and fishing |
27 |
9.2 |
| Public administration and safety |
16 |
1.7 |
| Manufacturing |
12 |
1.3 |
| Other services |
8 |
1.5 |
| Arts and recreation services |
6 |
2.3 |
| Mining |
6 |
2.1 |
| Accommodation and food services |
5 |
0.5 |
| Electricity, gas, water and waste services |
4 |
2.5 |
| Wholesale trade |
4 |
1.1 |
| Administrative and support services |
4 |
1.0 |
| Education and training |
4 |
0.3 |
| Retail trade |
4 |
0.3 |
| Professional, scientific and technical services |
2 |
0.2 |
| Rental, hiring and real estate services |
1 |
0.5 |
| Health care and social assistance |
1 |
<0.1 |
| Financial and insurance services |
0 |
0.0 |
| Information media and telecommunications |
0 |
0 |
In 2023, 62% of worker fatalities occurred in 3 industries. Transport, postal and warehousing fatalities accounted for 26% (51 fatalities), followed by fatalities in the Construction industry (23%; 45 fatalities) and Agriculture, forestry and fishing industry (14%; 27 fatalities). There were also some differences from the long-term average:
- the number of fatalities in the Construction industry in 2023 (45) was 36% higher than the 5-year average for this industry (33), and
- the number of fatalities in the Agriculture, forestry and fishing industry in 2023 (27) was 25% lower than the 5-year average (36).
Work-related injury and illness
Safe Work Australia compiles national workers’ compensation statistics using data obtained from workers’ compensation authorities in each state, territory and the Commonwealth government.
These data are collated into the National Data Set for Compensation-based Statistics (NDS), which is Safe Work Australia’s primary source of information on work-related injuries and diseases. See the NDS about data page for more information.
The following insights provide a snapshot of key findings from the latest data on work-related injuries and illnesses.
More information is available through our interactive data dashboard.
Compared with 10 years ago (2012-13), the number of serious claims has increased by 23,700 (or 20.5%).
However, when accounting for changes in hours worked, over this period the serious claims frequency rate has increased only marginally, up by 0.05 claims per million hours worked (or 0.8%).
There has been considerable variability in the serious claims frequency rate over the past 10 years. Between 2012-13 and 2015-16, sustained decreases were observed, and the serious claims frequency rate fell 15.5%, however since that time this figure has been trending upwards.
More needs to be done to reduce the number of serious claims for work-related injuries and illness in Australia.
Serious claims count and frequency rate, 2012‑13 to 2022-23p
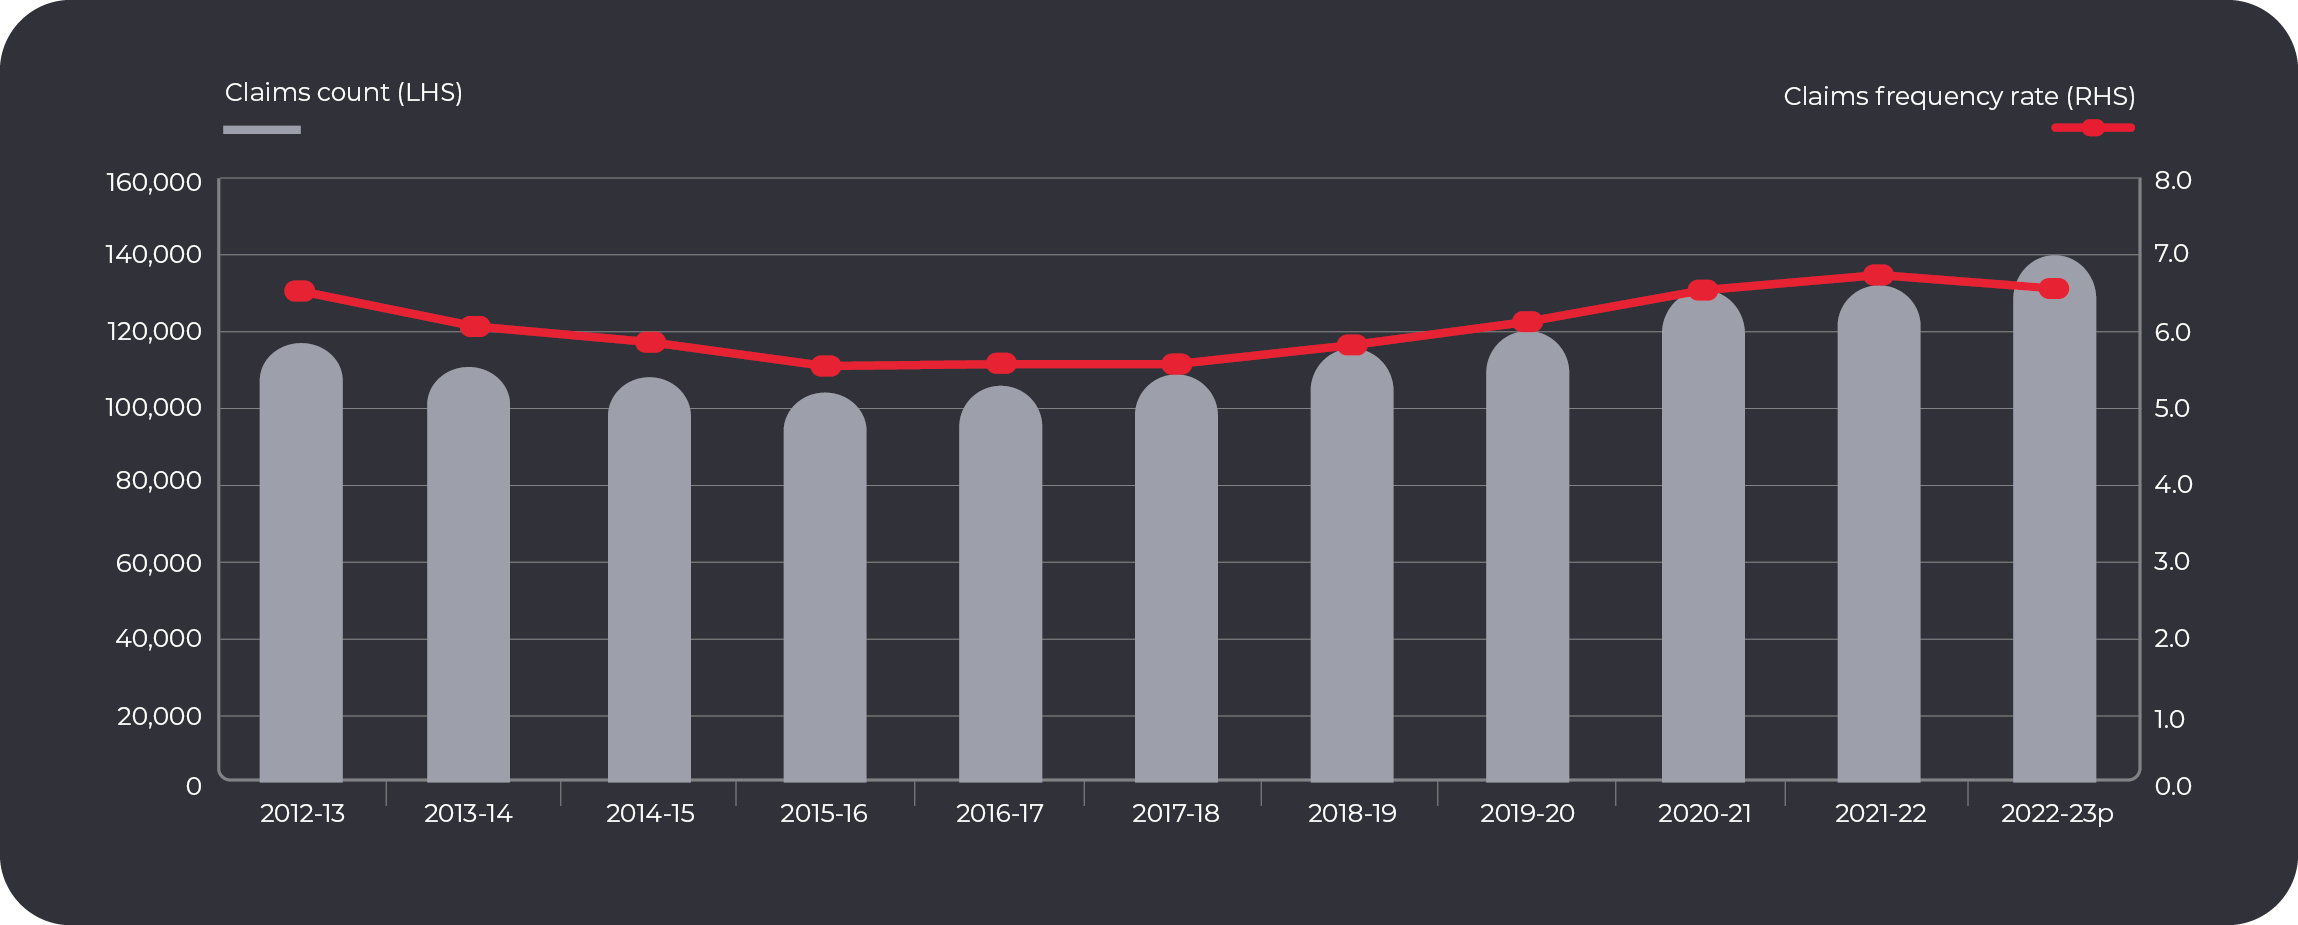
Note: In September 2023, Safe Work Australia implemented improvements to the estimates of the working population used to calculate injury rates from the National Dataset for Workers’ Compensation Statistics (NDS).2 Safe Work Australia advises caution when interpreting time series changes for rates calculated from the NDS spanning the period before and after this change.
Safe Work Australia funds the Australian Bureau of Statistics to conduct the Work-related injuries survey every 4 years. The latest data, for 2021-22, highlight that 3.5% of people who worked in the previous 12 months experienced a work-related injury or illness.
Only one-third (34.9%) of these workers made a workers’ compensation claim.
Significant time lost claims
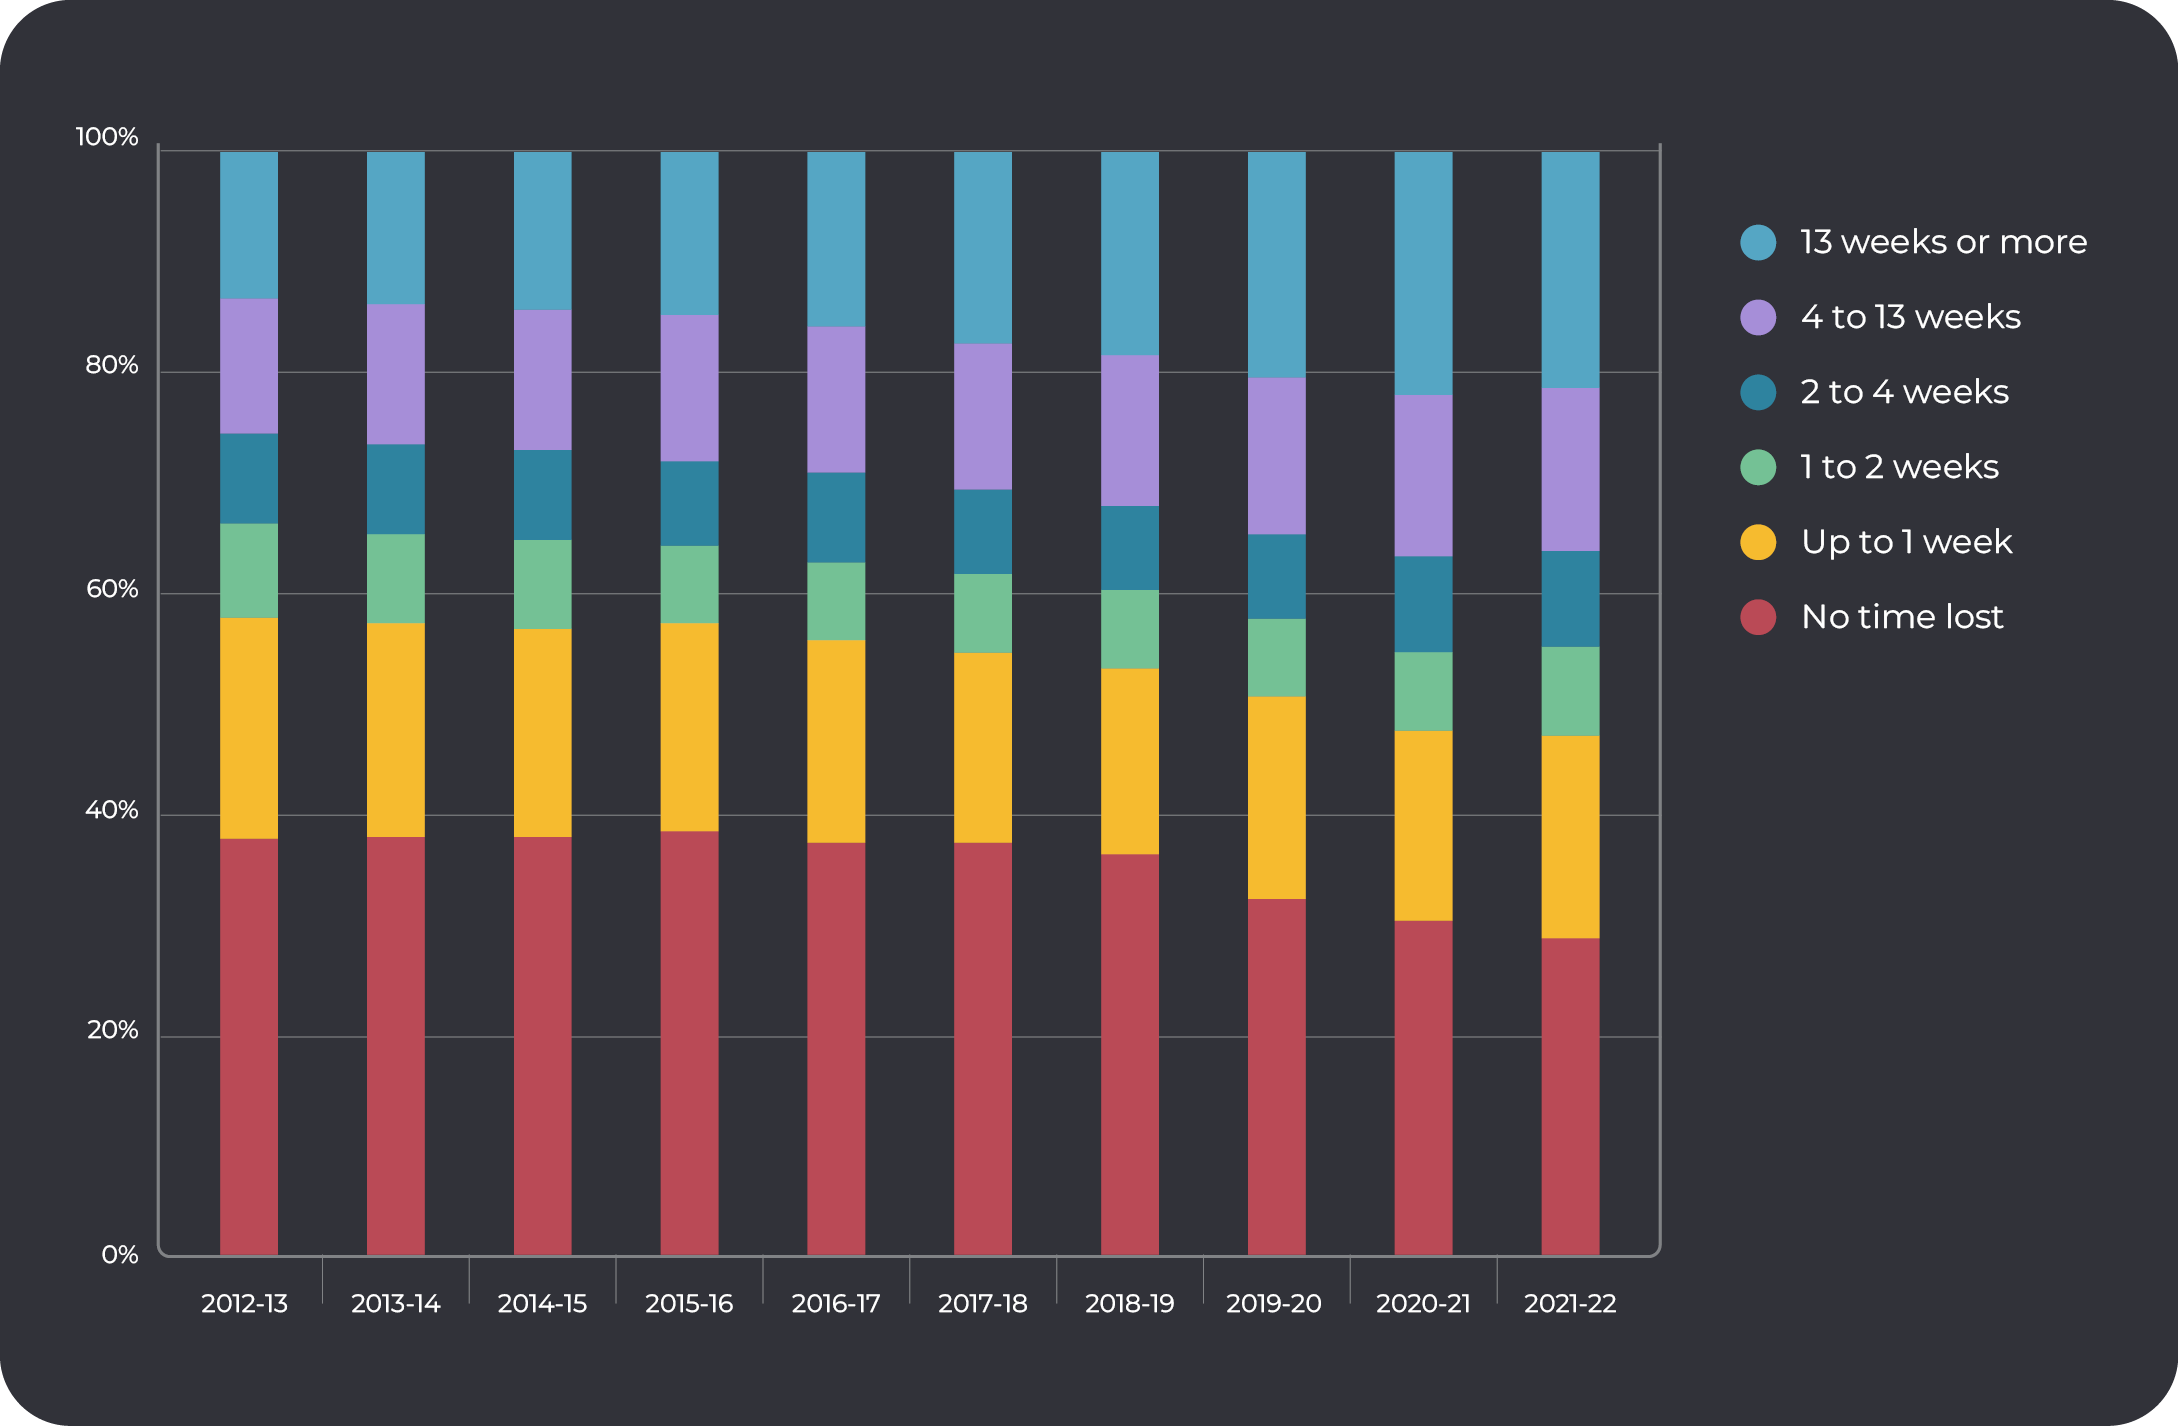
Median time lost from work-related injuries and illnesses has been increasing over the past 10 years. One contributing factor to this trend is that the number of claims with no time lost has decreased and, at the same time, the number of claims involving a significant period of time lost (at least 13 weeks) has increased.
The significance of this trend is highlighted by the latest (non-preliminary) results. 2021-22 data show claims involving 13 weeks or more time lost from work accounted for approximately one in 5 (21.3%, or 48,600 claims) of all accepted claims, but three-quarters (75.6% or $4.4 billion) of total compensation payments.
|
2012-13 |
2021-22 |
|
|---|---|---|
| Claims with no time lost (%) |
37.1% |
28.8% |
| Claims with 13 weeks or more time lost (%) |
13.4% |
21.3% |
All accepted claims (%) by total time lost groups, 2012-13 to 2021-22
Work-related injury and illness – Demographics (sex)
Serious claims by sex, 2022-23p
|
|
|
|
|---|---|---|
| Claims (count) |
81,400 |
56,900 |
| Claims (%) |
58.9% |
41.1% |
| Incidence rate |
12.4 |
8.8 |
| Incidence rate |
6.9 |
6.1 |
| Median time lost (weeks) |
7.0 |
7.6 |
| Median compensation paid ($) |
$15,600 |
$12,700 |
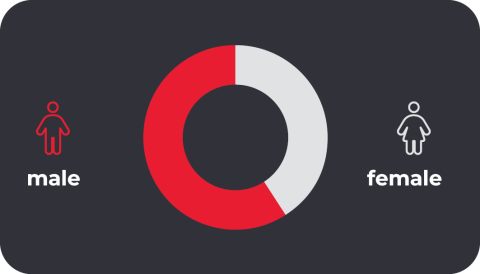
The majority of serious claims were made by men in 2022-23p, 81,400 or 58.9%. However, reflecting the trend of increasing female workforce participation, the share of serious claims accounted for by women (56,900 claims or 41.1%) has increased by 4.7 percentage points over the 10 years to 2022-23p. Once hours of work are accounted for, the serious claims frequency rate is 12.4% higher for men (6.9) compared to women (6.1).
Further:
- Serious claims for women have a higher median time lost (7.6 weeks) than serious claims for men (7.0 weeks).
- By contrast, serious claims made by men have a higher median compensation paid, $2,800 (or 22.3%) greater for men ($15,600) compared to women ($12,700).
Serious claims (%) by sex and most common nature (major group), 2022-23p
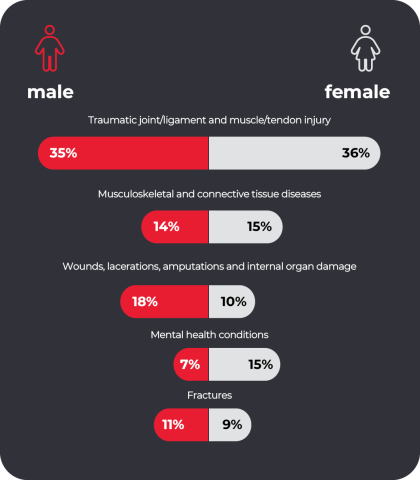
The nature of work-related injury and illness differs noticeably between men and women. Women have a much higher share of work-related injury or illness accounted for by Mental health conditions (15.0%, compared to 7.4% for men), whilst men have a higher share of work-related injury or illness accounted for by Wounds, lacerations, amputations and internal organ
damage (18.3%, compared to 9.7% for women).
These differences are at least in part due to the different types of work that men and women undertake across the Australian labour market.
Work-related injury and illness – Demographics (age)
The frequency rate, median time lost, and median compensation costs of serious claims generally increase with age.
Taking into account the hours worked by different groups of workers, the serious claims frequency rate was highest for those aged 55-64 years old and 65 years and over in 2022-23p (8.9 serious claims per million hours worked). The lowest serious claims frequency rate was among workers aged 25-34 years old and 35-44 years old (5.6 serious claims per million hours worked).
In line with Australia’s aging workforce, the proportion of serious claims accounted for by the 65 years and over cohort of workers is increasing over time. Over the 10-years to 2022-23p, this proportion has almost doubled (up 1.9 percentage pts) to 4.0% of serious claims in 2022-23p.
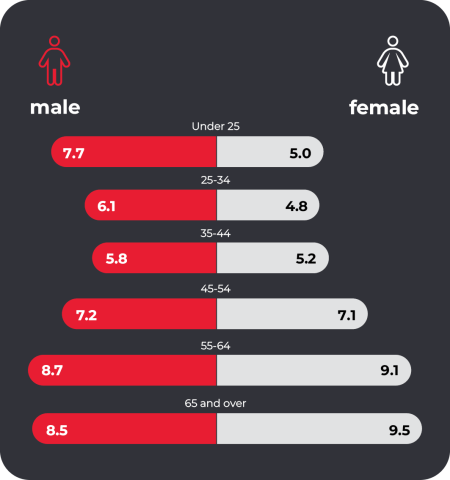
Moreover, the serious claims frequency rate is higher for men for age cohorts up to the 45-54 years old bracket, however, for workers aged 55 years and over, this trend reverses, with the serious claims frequency rate for women greater than that for men.
Serious claims by age, 2022-23p
| Age group |
Claims (count) |
Claims (%) |
Incidence rate |
Frequency rate |
Median time lost |
Median |
|---|---|---|---|---|---|---|
| Under 25 |
18,000 |
13.0% |
8.1 |
6.5 |
3.9 |
$6,300 |
| 25-34 |
29,600 |
21.3% |
9.5 |
5.6 |
5.6 |
$11,000 |
| 35-44 |
28,100 |
20.2% |
9.6 |
5.6 |
7.5 |
$15,900 |
| 45-54 |
31,600 |
22.8% |
12.6 |
7.1 |
9.3 |
$19,600 |
| 55-64 |
26,100 |
18.8% |
14.6 |
8.9 |
10.6 |
$21,200 |
| 65 and over |
5,600 |
4.0% |
11.6 |
8.9 |
11.6 |
$22,400 |
Serious claims (frequency rate) by sex and age group, 2022-23p
Work-related injury and illness – Nature of injury or disease (vii)
Serious claims by nature classification, 2022-23p
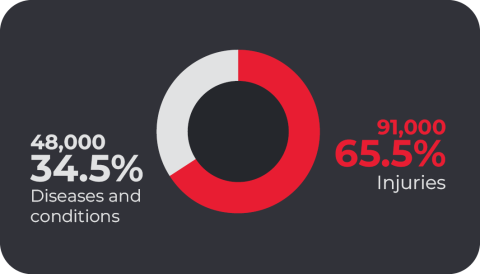
Over time, the nature of serious workers’ compensation claims is changing, with the share of Diseases and conditions serious claims growing from one in 4 serious claims (25.8% in 2012-13) to more than one in 3 serious claims (34.5% in 2022-23p).
Serious claims by most common nature major groups, 2022‑23p
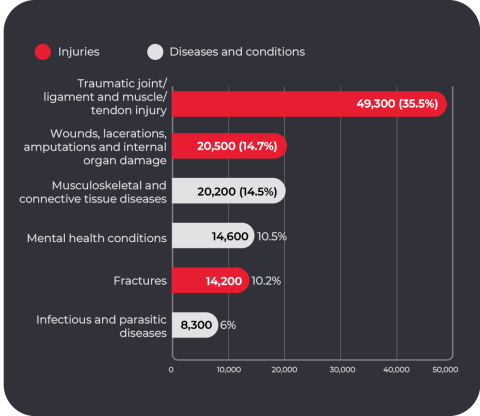
The nature of injury or disease groups with the largest increases in serious claims over the 10 years to 2022-23p were infectious and parasitic diseases (up by 8,000, driven largely by the onset of COVID-19 from 2020-21 onwards) and mental health conditions (up by 7,200).
Two-thirds (or 64.8%) of all serious claims were concentrated in just 3 nature of injury or disease groups:
Serious claims by nature major groups, 2022-23p
| Nature (classification) | Nature (major group) |
Claims (count) |
Claims (%) |
Median time lost |
Median |
|---|---|---|---|---|---|
| Injuries | Traumatic joint/ligament and muscle/tendon injury |
49,300 |
35.5% |
7.2 |
$14,355 |
| Wounds, lacerations, amputations and internal organ damage |
20,500 |
14.7% |
3.8 |
$9,565 |
|
| Fractures |
14,200 |
10.2% |
10.0 |
$19,199 |
|
| Other injuries |
3,500 |
2.5% |
4.6 |
$9,067 |
|
| Burns |
1,900 |
1.4% |
2.5 |
$3,664 |
|
| Intracranial injuries |
1,300 |
1.0% |
4.7 |
$8,812 |
|
| Injury to nerves and spinal cord |
180 |
0.1% |
11.2 |
$28,595 |
|
| Diseases and conditions | Musculoskeletal and connective tissue diseases |
20,200 |
14.5% |
14.2 |
$23,457 |
| Mental health conditions |
14,600 |
10.5% |
37.0 |
$65,402 |
|
| Infectious and parasitic diseases |
8,300 |
6.0% |
1.3 |
$1,906 |
|
| Digestive system diseases |
2,000 |
1.4% |
7.4 |
$18,062 |
|
| Nervous system and sense organ diseases |
1,300 |
0.9% |
14.6 |
$27,885 |
|
| Other claims |
700 |
0.5% |
4.8 |
$9,948 |
|
| Skin and subcutaneous tissue diseases |
420 |
0.3% |
3.8 |
$7,311 |
|
| Respiratory system diseases |
230 |
0.2% |
7.1 |
$17,645 |
|
| Circulatory system diseases |
110 |
0.1% |
16.8 |
$31,358 |
|
| Other diseases |
100 |
0.1% |
10.8 |
$20,844 |
|
| Neoplasms (cancer) |
80 |
0.1% |
11.8 |
$47,801 |
Data spotlight: Mental health conditions
Mental health conditions accounted for 10.5% or 14,600 serious claims in 2022-23p. This is a 19.2% increase on 2021-22, and a 97.3% increase compared with 10 years ago.
Over the 10 years to 2022-23p, the proportion of claims for Mental health conditions has increased from 6.4% in 2012-13 to 10.5% in 2022‑23p.
Over this period the number of serious claims for Mental health conditions has increased by 7,200 (97.3%).
- This represents the second largest growth in the number of serious claims for a nature of injury/illness major group observed over the period (just behind the growth of 8,000 Infectious diseases serious claims, driven by COVID-19).
Mental health conditions are one of the costliest forms of workplace injury. They lead to significantly more time off work and higher compensation paid when compared to physical injuries and diseases.
- The median time lost from Mental health condition serious claims in 2021-22 (37.0 working weeks) was more than 5 times the median time lost across all serious claims (7.2).
- The median compensation paid for Mental health condition serious claims in 2021‑22 ($65,400) was more than 4 times the median compensation paid across all serious claims ($14,400).
Work-related injury and illness – Mechanism of incidentix
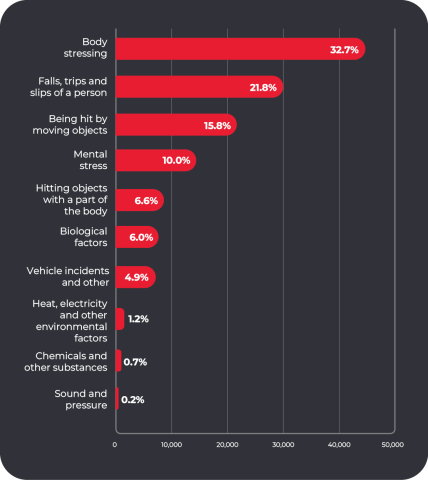
More than three-quarters (80.3%) of serious claims were concentrated in 4 of the 10 mechanism of incident major groups.
Serious claims by mechanism major groups, 2022-23p
Serious claims by mechanism major groups, 2022-23pviii
| Mechanism (major group) |
Claims (count) |
Claims (%) |
Median time lost |
Median |
|---|---|---|---|---|
| Body stressing |
45,000 |
32.7% |
9.2 |
$17,800 |
| Falls, trips and slips of a person |
30,300 |
21.8% |
8.8 |
$16,600 |
| Being hit by moving objects |
22,000 |
15.8% |
5.6 |
$12,000 |
| Mental stress |
13,900 |
10.0% |
38.1 |
$67,400 |
| Hitting objects with a part of the body |
9,100 |
6.6% |
3.8 |
$9,600 |
| Biological factors |
8,400 |
6.0% |
1.3 |
$1,900 |
| Vehicle incidents and other |
6,800 |
4.9% |
8.0 |
$17,900 |
| Heat, electricity and other environmental factors |
1,700 |
1.2% |
2.5 |
$3,800 |
| Chemicals and other substances |
1,000 |
0.7% |
4.0 |
$7,300 |
| Sounds and pressure |
200 |
0.2% |
9.5 |
$17,000 |
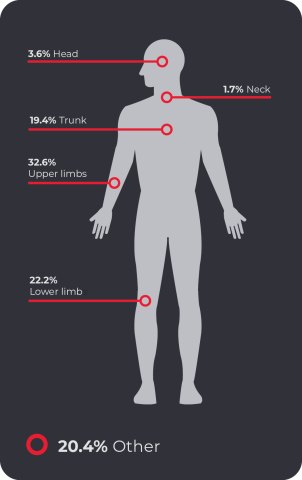
Work-related injury and illness – Bodily location of injury or diseasex
Serious claims by bodily location major groups, 2022-23p
| Bodily location (major group) |
Claims (count) |
Claims (%) |
Median time lost |
Median |
|---|---|---|---|---|
| Head |
5,000 |
3.6% |
3.4 |
$6,900 |
| Neck |
2,400 |
1.7% |
10.0 |
$18,700 |
| Trunk |
27,000 |
19.4% |
7.0 |
$12,900 |
| Upper limbs |
45,300 |
32.6% |
7.4 |
$16,200 |
| Lower limbs |
30,900 |
22.2% |
7.8 |
$14,800 |
| Other |
4,500 |
20.4% |
|
|
Work-related injury and illness – Industry
Serious claims by most common industry divisions, 2022‑23p
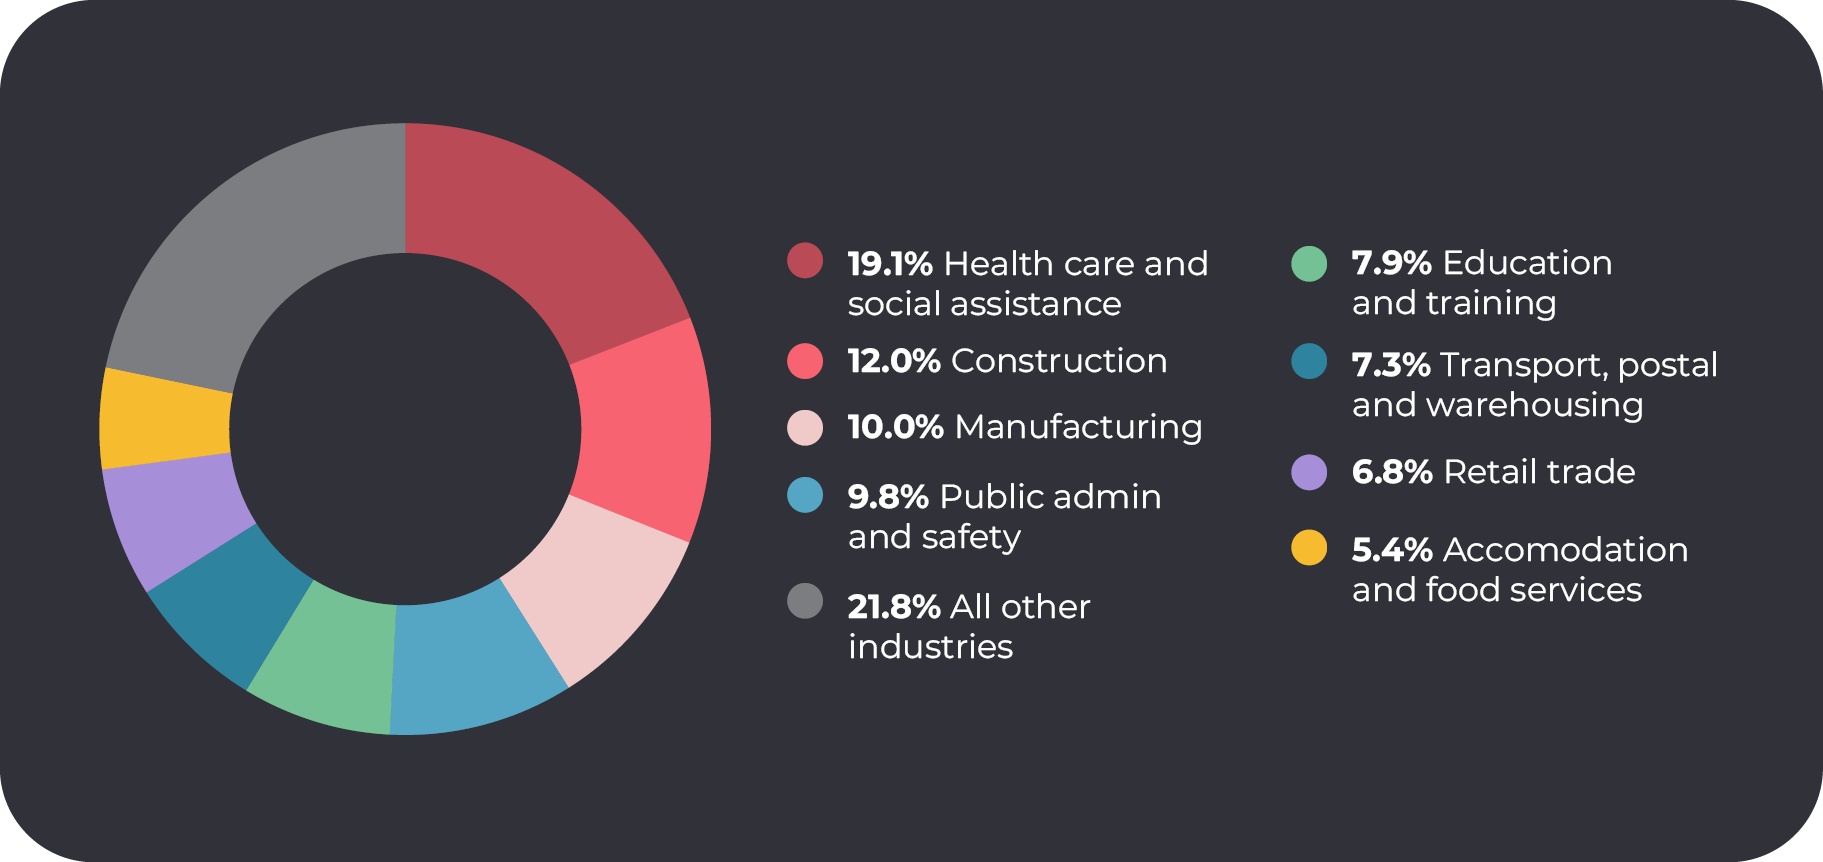
Work-related injuries and illnesses are concentrated in certain parts of the labour market.
In 2022-23p, the 4 industry divisionsxi with the largest number of serious claims accounted for half (81,500 or 50.8%) of all serious claims, despite representing 36.0% of jobs.
Largest serious claims frequency rate by industry divisions, 2022-23p
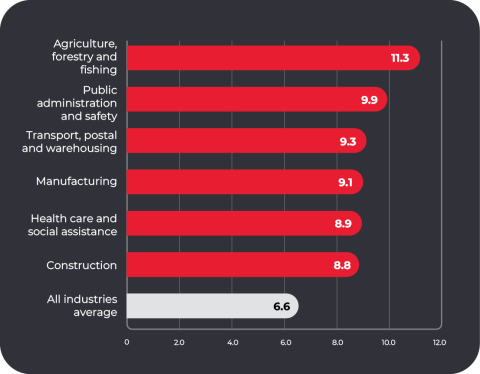
Accounting for hours worked, the Agriculture, forestry and fishing industry recorded the highest serious claims frequency rate in 2022-23p, 11.3 claims per million hours worked. This represents a frequency rate of serious claims almost double the average observed across all industries (6.6). Other industries with notably high claim frequency rates include Public administration and safety (9.9), Transport, postal and warehousing (9.3), Manufacturing (9.1), Health care and social assistance (8.9), and Construction (8.8). Together, these industries accounted for 60.9% of serious claims in 2022-23p.
Serious claims by industry division, 2022‑23p
| Industry division |
Claims (count) |
Claims (%) |
Incidence rate |
Frequency rate |
Median time lost |
Median |
|---|---|---|---|---|---|---|
| Health care and social assistance |
26,500 |
19.1% |
12.7 |
8.9 |
7.2 |
$11,700 |
| Construction |
16,600 |
12.0% |
17.2 |
8.8 |
8.5 |
$18,500 |
| Manufacturing |
13,800 |
10.0% |
16.7 |
9.1 |
7.0 |
$15,800 |
| Public administration and safety |
13,600 |
9.8% |
16.7 |
9.9 |
7.4 |
$18,000 |
| Education and training |
11,000 |
7.9% |
9.2 |
6.1 |
5.2 |
$12,700 |
| Transport, postal and warehousing |
10,200 |
7.3% |
17.1 |
9.3 |
8.8 |
$18,400 |
| Retail trade |
9,500 |
6.8% |
7.0 |
5.2 |
6.5 |
$10,500 |
| Accommodation and food services |
7,400 |
5.4% |
7.8 |
6.2 |
4.4 |
$6,600 |
| Administrative and support services |
5,600 |
4.0% |
8.7 |
5.2 |
8.0 |
$12,500 |
| Wholesale trade |
5,000 |
3.6% |
14.4 |
7.9 |
7.2 |
$15,300 |
| Other services |
3,900 |
2.8% |
9.1 |
5.4 |
7.6 |
$16,200 |
| Agriculture, forestry and fishing |
3,800 |
2.7% |
20.9 |
11.3 |
7.0 |
$13,400 |
| Mining |
3,100 |
2.2% |
15.2 |
7.1 |
10.8 |
$34,300 |
| Arts and recreation services |
2,600 |
1.9% |
11.1 |
8.6 |
6.0 |
$9,200 |
| Professional, scientific and technical services |
2,400 |
1.7% |
2.0 |
1.1 |
7.7 |
$17,700 |
| Electricity, gas, water and waste services |
1,400 |
1.0% |
10.7 |
5.7 |
8.2 |
$20,400 |
| Rental, hiring and real estate services |
1,300 |
0.9% |
6.5 |
3.6 |
8.3 |
$16,900 |
| Information media and telecommunications |
600 |
0.4% |
3.3 |
1.9 |
4.6 |
$13,100 |
| Financial and insurance services |
570 |
0.4% |
1.1 |
0.6 |
15.2 |
$32,400 |
Work-related injury and illness – Occupation
Serious claims by occupation major group, 2022-23p
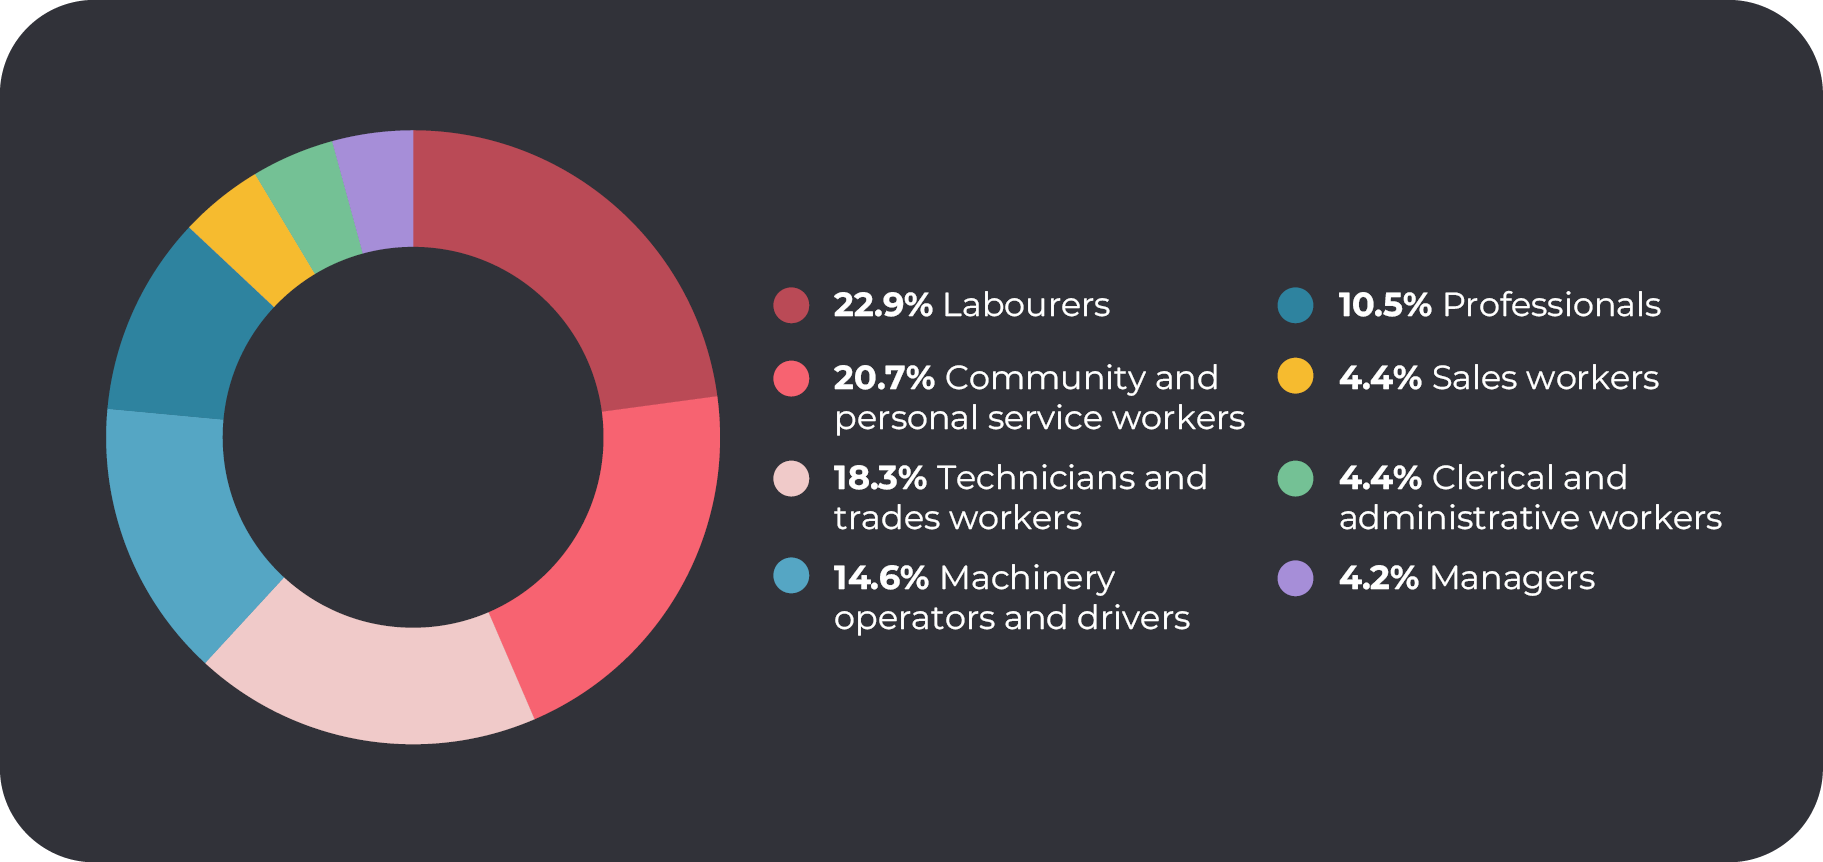
Some jobs involve higher levels of exposure to hazards and potential harm. In 2022-23p, 61.8% of serious claims were accounted for by just 3 of the 8 occupation major groupsxii:
- the largest proportion of serious claims was recorded for Labourers (22.9%), followed by
- Community and personal service workers (20.7%), and
- Technicians and trades workers (18.3%).
Notably, labourers accounted for 22.9% of serious claims in 2022-23p – nearly 3 times as high as the proportion of jobs they represent (8.4%). Other occupation groups with disproportionately high shares of serious claims include:
- Machinery operators and drivers, accounting for 14.6% of serious claims and 6.0% of jobs
- Community and personal service workers, accounting for 20.7% of claims and 11.8% of jobs
- Technicians and trades workers, accounting for 18.3% of serious claims and 12.2% of jobs.
References and endnotes
1 Australian Bureau of Statistics, Work-related injuries survey, 2021-22; International Labour Organisation estimates of work-related injuries and employment (2019).
2 Safe Work Australia, Review of data used to calculate injury rates, 2023.
3 Australian Bureau of Statistics, Labour Force, Australia Detailed, June 2024.
i Data for 2022-23 are preliminary (denoted by ‘p’) and subject to revision in future years as further claims are finalised.
ii Data in this report refers to serious claims unless otherwise indicated. Serious claims resulted in one working week or more time off work.
iii The claim ‘Incidence rate’ is defined as the number of claims per thousand workers, using estimates of the working population covered under a workers’ compensation scheme.
iv The claim ‘Frequency rate’ is defined as the number of claims per million hours worked, using estimates of the working population covered under a workers’ compensation scheme.
There are significant differences in the number of hours worked by different groups of employees, and employees at different points in time. The claims frequency rate accounts for these differences and allows for more accurate comparisons between different groups of workers and over time.
v Median time lost is not reported for the preliminary data year because some claims remain open. Data for the most recent non-preliminary reporting period (2021-22) is used for reporting purposes in such instances.
vi The median compensation paid excludes claims where there was zero compensation paid.
Median compensation paid is not reported for the preliminary data reference period because some claims remain open and may affect this calculation. Data for the most recent non-preliminary reporting period (2021-22) is used for reporting purposes in such instances.
vii Nature refers to the most serious injury or disease sustained or suffered by the worker.
See the Type of Occurrence Classifications System (TOOCS) about data page for further information on the Nature coding structure.
viii Claims counts in detailed tables may not sum to overall reported total as some records have ‘other’ or missing values for descriptive variables.
ix Mechanism identifies the overall action, exposure or event that best describes the circumstances that resulted in the most serious injury or disease.
x Bodily location refers to the part of the body affected by the most serious injury or disease.
xi Industry refers to the range of economic activities undertaken by a business to produce goods and services, and is categorised using the Australian Bureau of Statistics (ABS) Australian and New Zealand Standard Industrial Classification (ANZSIC).
xii Occupation refers to the type of job undertaken by a worker in the labour market and is categorised using the Australian Bureau of Statistics (ABS) Australian and New Zealand Standard Classification of Occupations (ANZSCO).